Introduction
If you’re reading this guide, props to you (no pun intended). By signing up for Hall of Fame Bets, you’re already well on your way to becoming a smarter and more data driven sports bettor.
Our goal at HOF Bets is to provide you with the analytics you need to bet with confidence, have fun with the process, and hopefully win more too!
If you are looking for more information on any of our other features, simply click its name and you will be directed to its respective tutorial.
Currently, we offer five tools per sport:
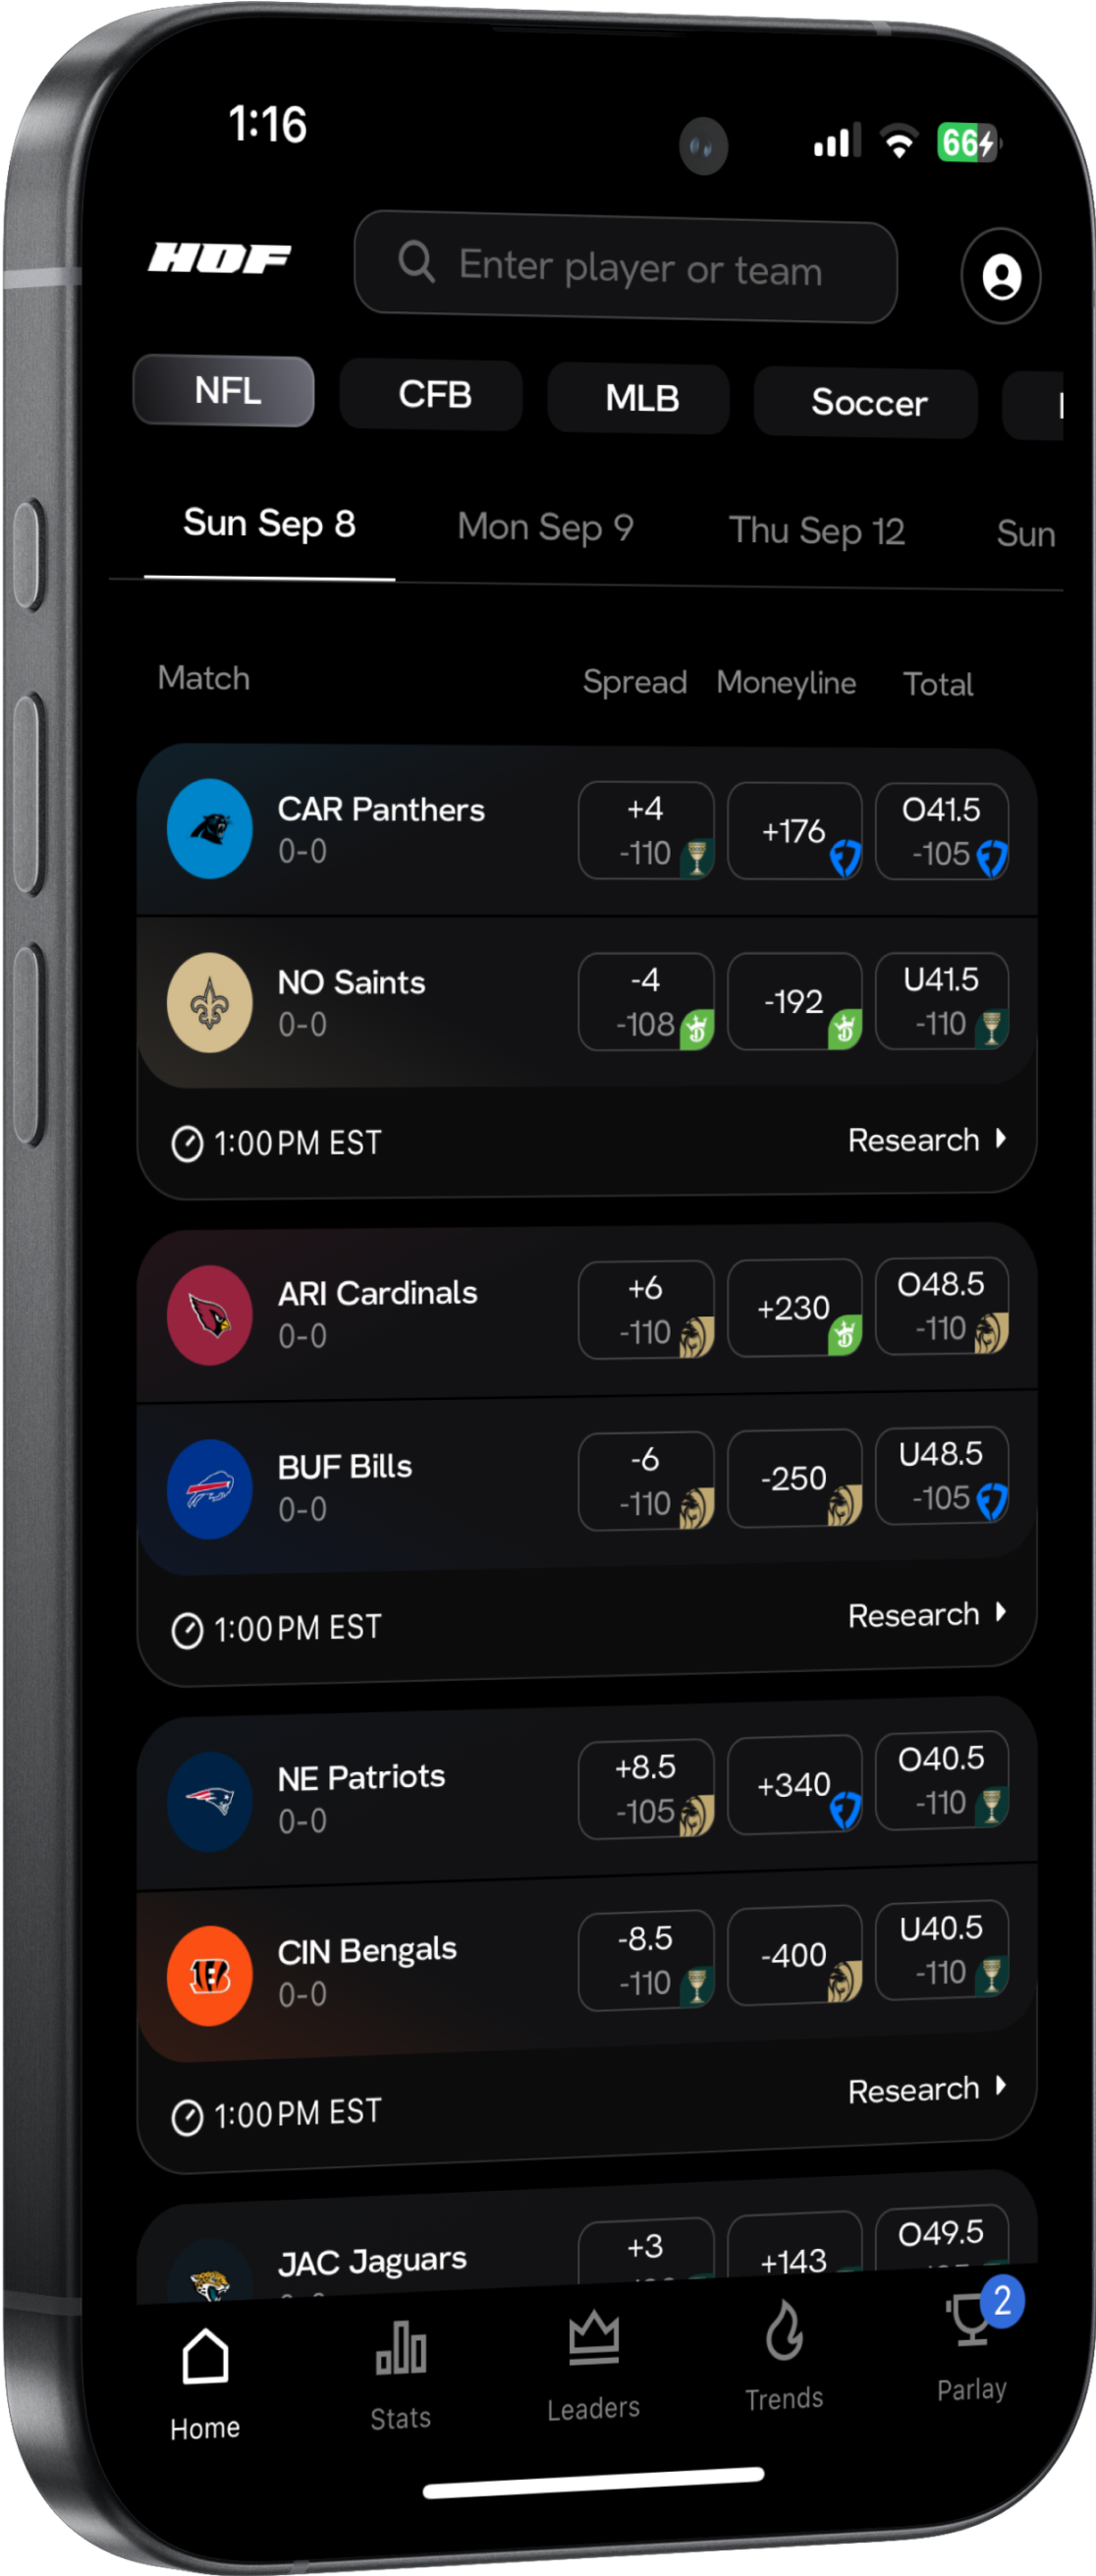
- Home
Get an overview of any and all upcoming games with the home page. Clicking on any game will give you a high-level overview of the matchup, breaking down the most crucial stats and highlighting the players to look out for.
- Deep Stats (You are here)
Look up any player or team to view in depth analytics showing hit rates, charts, game logs, and matchup info. Apply powerful filters like H2H, playoffs, minutes played, with or without teammates, opponent strength, and more to slice and dice the data.
- Parlay Optimizer
Enter any SGP or SGP+ you're considering and get innovative analytics with hit rates broken down by leg and projected probability for the parlay. Get insights on which legs to cut and which to increase, based on the cold hard data.
- Leaderboards
View player rankings by hit rate for any prop you'd like to research (for example, 25+ points or 10+ rebounds) over the entire season or recent time frames (last 5, last 10, last 20 games) to get an idea of which players are on hot streaks.
- Trends
View the most valuable plays currently being offered by sportsbooks, sorted by edge. This tool breaks down the differences between the implied odds of lines being offered by sportsbooks and their historical hit rates to bring you strong plays to add to your betslip.
We’ll walk you through how to use each tool using examples along the way. HOF Bets is the shiny new weapon in your sports betting arsenal, and this article is a training session to prepare you for optimal performance next time you bet.
Deep Stats
Deep Stats is a great place to begin your daily research. Deep Stats allows you to research individual player props and game lines, as well as examining the entire roster for a given team.
Think of individual legs as puzzle pieces, and a winning parlay as the assembled puzzle. When building a puzzle, grabbing pieces quickly and hoping they’ll fit together usually doesn’t work. Instead, we need to carefully scan the available pieces and pick the right ones to assemble.
Similarly, in sports betting, it’s important to examine each bet or leg you’re placing at an individual level.
Bonus Tip: It’s wise to place straight bets in addition to your parlays. Due to the nature of parlays requiring multiple legs to hit, they can be mathematically tougher to profit from consistently.
To use a finance metaphor here, parlays are like penny stocks or crypto – big risk, big reward. But you wouldn’t build a portfolio of just penny stocks and crypto, right? Straight bets are like blue chip stocks or index funds – they won’t make you rich overnight, but they’re much more reliable.
When you open deep stats, you'll see a search bar, a menu for switching between sports, as well as any recent searches you may have.

If you scroll down further, you can find Trending Searches, which can be a great pointer if you are uncertain of players you may want to research.

If you have a player in mind that you want to search, all you have to do is search in a player name or click on their name to move over to their Stats page. To start our deep dive into things, let’s look at Baker Mayfield, quarterback of the Tampa Bay Buccaneers.
This is what you will see when you open up his page.

On any Stats page, you will see three different tabs you can toggle between: Player, Roster, and Team. To start off things, we will dive into the Player tab.
The Player Tab
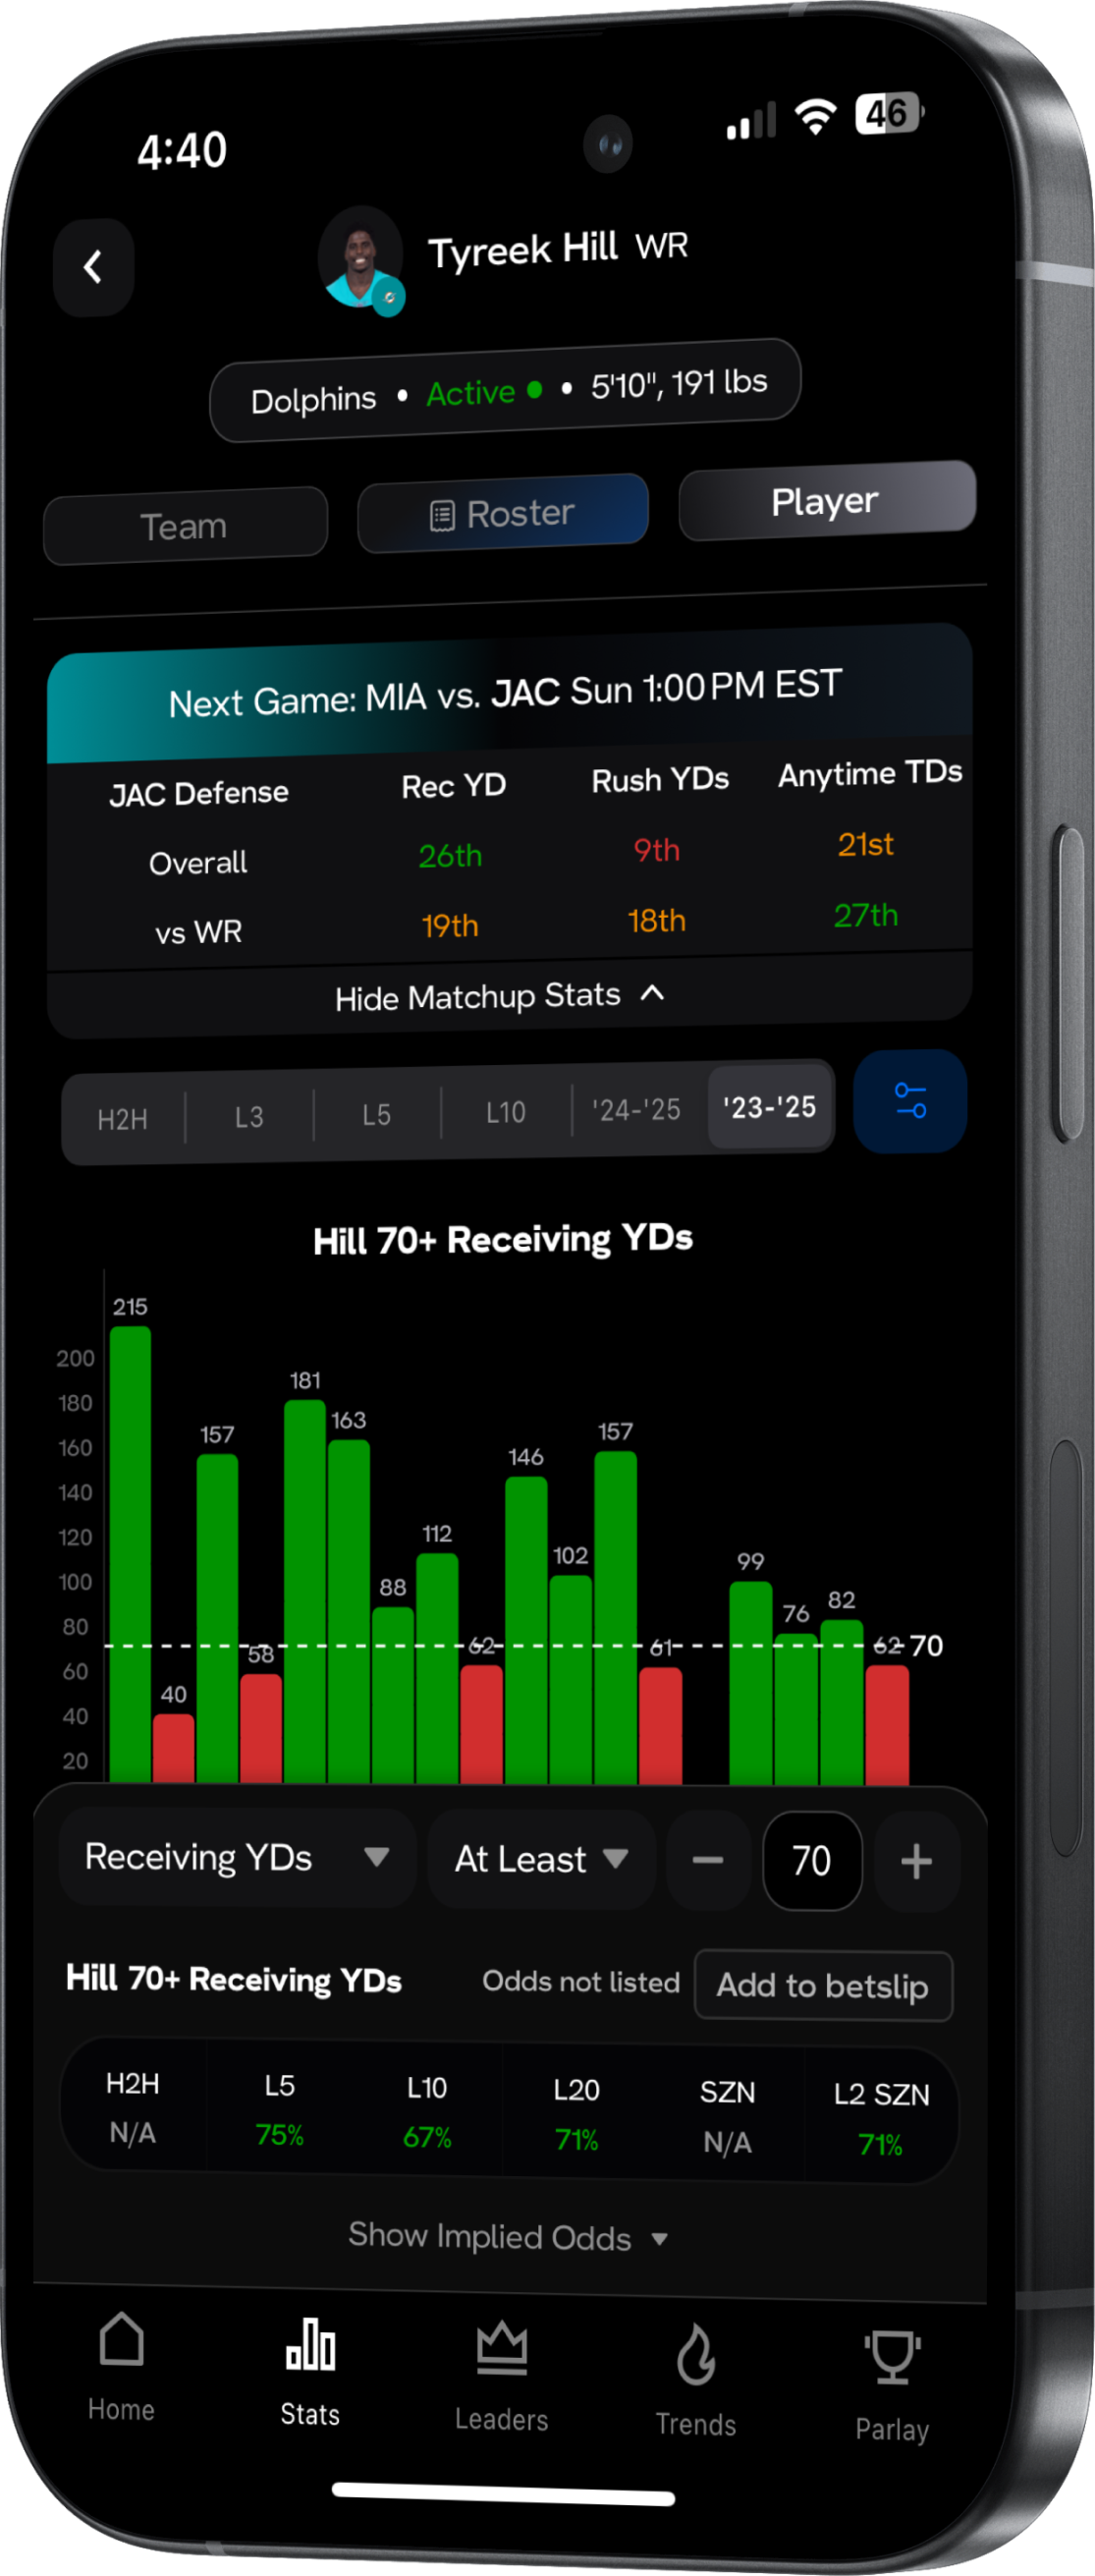
At the top of the page, you will see our Matchup Boxes.

These boxes can be a great place to get some quick context on how the upcoming opponent may affect a player's ability to hit their lines. For example, the Saints are a good matchup for passing yards, ranking 24th in the league in passing yards allowed, but are the best defense in the league when it comes to giving up passing touchdowns. As a result, you might be better off looking at his passing yards lines, rather than his passing touchdowns!
Next, we have the main portion of Stats — charts that breakdown any imaginable line you might want to look at for your given player. To start things off, we will continue with Mayfield and look at how often he has been able to pass for 225+ passing yards.

From this, we can see that Baker has not been great against this line so far this season, only managing to hit the line twice over his five games, giving him a 40% hit rate.
The real power of the Stats page comes from your ability to manipulate this data and look at additional factors that can have serious impact on your betting lines. Perhaps the most useful is the ability to switch the time frame that you are looking at. Clicking through the different buttons above the graph, you can change the amount of games this line is applied to. Below, we have a look at his performance over the last two years.

We can see that perhaps this year has not been the best sample size, as his performances over the longer stretch have a much better hit rate here.
Beyond this, we have a number of powerful filters that can add even more context. Clicking on the filter toggle, a menu opens up with a number of different filtering options that give you the ability to narrow things down as much as you want.

We will go ahead and apply the following filters to get a better perspective on Baker's chances of hitting this line: Away Games Only and Top 50% Ranked Defenses.

When looking at this, we can see that Baker has had good performances under these conditions over the past two years. If we want to tweak the line that we are looking at or even change to another stat, all we have to do is toggle the menu below. For instance, we could change this to look at Baker getting 10+ rushing yards in a game, with the same conditions applied.

From this we can see that Baker has been great in stretches at this line, but particularly strong so far this season! To help contextualize from the chart to what actual hit rates and odds would be, all we need to do is look below to the odds menu.

From here, we can see what hit rates and odds are for all the different time horizons at once. If you prefer to see how those hit rates translate into odds, you can toggle on that view as well with the button below.
There are two more sections to the Player tab that can help you find the information you need to feel great about your bets. Scrolling down below the charts, you will see game logs.

The game logs are automatically formatted to the conditions that you have applied. For example, we currently are looking at the last two years, filtered down to just games that Mayfield played on the road against top-half defenses. Teams are color coded to represent what the matchup grades were for each contest.
Finally, scrolling down one section more, we arrive at Recent Stat Lines. This is a nifty feature that allows you to see how past players at the same position performed against the upcoming opposition. This can be a useful way to see how teams have performed more recently against upcoming opponents and can help you gain insight into how your player might perform similarly.

That wraps things up for the Player tab, but as mentioned, there is a lot more to cover with the Stats tool! Next, let's move on to the Team tab.
The Team Tab
Teams functions basically the same as the Player tab, with only two major differences: matchup boxes are more flexible and provide a more comprehensive breakdown of the upcoming matchup, and the stats provided to go through are oriented towards team results, such as money line or spread.
When you open up the Team Tab, it will automatically be that of the player you were just on, or the team that you searched up if you came to it that way. Below is what you will see when you first open up the Team tab.

Diving into the key differences, you can see that the breakdown in the matchup box is more detailed. On Teams, you have the ability to see more composite metrics such as Total Yards and Total TDs, which can help you understand the overall picture, rather than a more focused one that we saw previously.

One of the big advantages of this view is the ability to switch between offense and defense. By doing this, you can get a quick visualization of how both sides of the ball line up for both teams.
Beyond this, the functionality of the Teams tab is essentially the same as Player.

Game logs and charts will format to any filters you applied, showing you how the entire team performed under those given conditions.
Finally, we wrap up our deep dive by looking at the Roster tab.
The Roster Tab
The roster tab does an excellent job of blending together some of the aspects of the other two tabs, giving you a comprehensive overview of how stats vary across the entire time. When you open up the roster tab, this is what you will come across.

The matchup boxes remain the same from the team tab, but there are two new additions: a recap of any injury statuses and a breakdown of the entire team's individual stats.

One particularly useful feature of this tab is the ability to apply filters and see how that changes the statistical output for players. One particularly useful filter for this tab is selecting with or without players. For instance, we have applied a filter of Without Sterling Shepherd, the current WR3 for the Bucs. As you can see, this leads to a big increase in the output of Chris Godwin, so if Shepherd were to miss a game, that might be a good reason to bet on his upside.

The Stats tool is a varied, deep, and insightful tool that can be tricky at first, but incredibly valuable once you master it. Putting all three tabs together can be a game changer and by reading this guide, you are well on your way to sports betting success!
Need help with some of our other tools? Check out our other guides linked above.
Take the question out of betting research with HOF Bets. Optimize your bets using sports betting analytics like these and many more, available on our platform at hofbets.com or by downloading our new iOS app here. Get started with us today for the best player prop and sports betting research.