The MLB season brings with it countless opportunities for sports bettors and enthusiasts alike. Whether you’re trying to predict game outcomes, team totals, or player props, having the right information at your fingertips is crucial. That’s exactly why we’re thrilled to unveil our latest updates: a brand-new pitcher ratings chart, a recent batting form chart, and our upgraded detailed matchup and batter vs. pitcher analysis tools. In this post, we’ll walk through how each feature helps make smarter betting decisions. Along the way we will include examples of how to best use each tools for creating picks, illustrating exactly how these new tools can simplify and improve your MLB betting process.
1. Pitcher Ratings Chart (Home Page)
Our first new addition is the Pitcher Ratings Chart, now conveniently located on the home page. This chart does the heavy lifting by highlighting both starting pitchers for an upcoming game in a concise, visually appealing format.
The stats included are intended to give you a quick read on some of the most popular pitching props to bet on, making this a one-stop shop if you are looking for some quick picks. Here, you’ll see how each pitcher stacks up, including:
- K/Game
- Outs/Game
- ER/Game
- HR/Game
- NRFI/YRFI
Below we have included an example for today’s matchup between the Los Angeles Angels and the Saint Louis Cardinals, with Yusei Kikuchi and Sonny Gray toeing the mound for each team respectively. As we are still early in the season, it is more illustrative to look into the stats from this season and last to give a better sample size.

From this chart, we can see that both pitchers rank well in strikeouts, while Gray also does superb in the outs per game category. Likewise, we can see that both pitchers have a relatively strong rating for NRFI, so that could be an interesting stat to add in as well.
Diving in a bit more on Gray’s stats page, we can see that his hit rate for 6+ strikeouts is 86% for last year, making that a strong bet. Let’s add that to our bet slip and move on.
2. Recent Batting Form Chart (Home Page)
Right below the pitcher ratings, you’ll find our new Recent Batting Form Chart. Instead of getting lost in dozens of complex statistics, this addition breaks down each team’s batting performance in an easy-to-understand snapshot. Similar to the Pitcher Ratings, this chart is great for identifying important stats about each team to get a read on the game, but can also be a great resource if you enjoy taking team totals. You’ll see the following stats:
- Hits
- Home Runs
- Total Bases
- Runs
- Strikeouts
Sticking with our earlier example, let’s look at this chart for the same game between the Angels and the Cardinals. Because hitting is a bit more reliant on recent form, let’s just look at stats from this season.

This shows a tale of two different trends, with the Angels struggling across the board and the Cardinals doing extremely well so far. With their strong batting so far, we can target a more conservative line such as over 3.5 team runs for the Cardinals, which has been perfect so far this season. Let’s add that to the betslip and continue.
3. Opposing Pitcher Ratings (Stats Page)
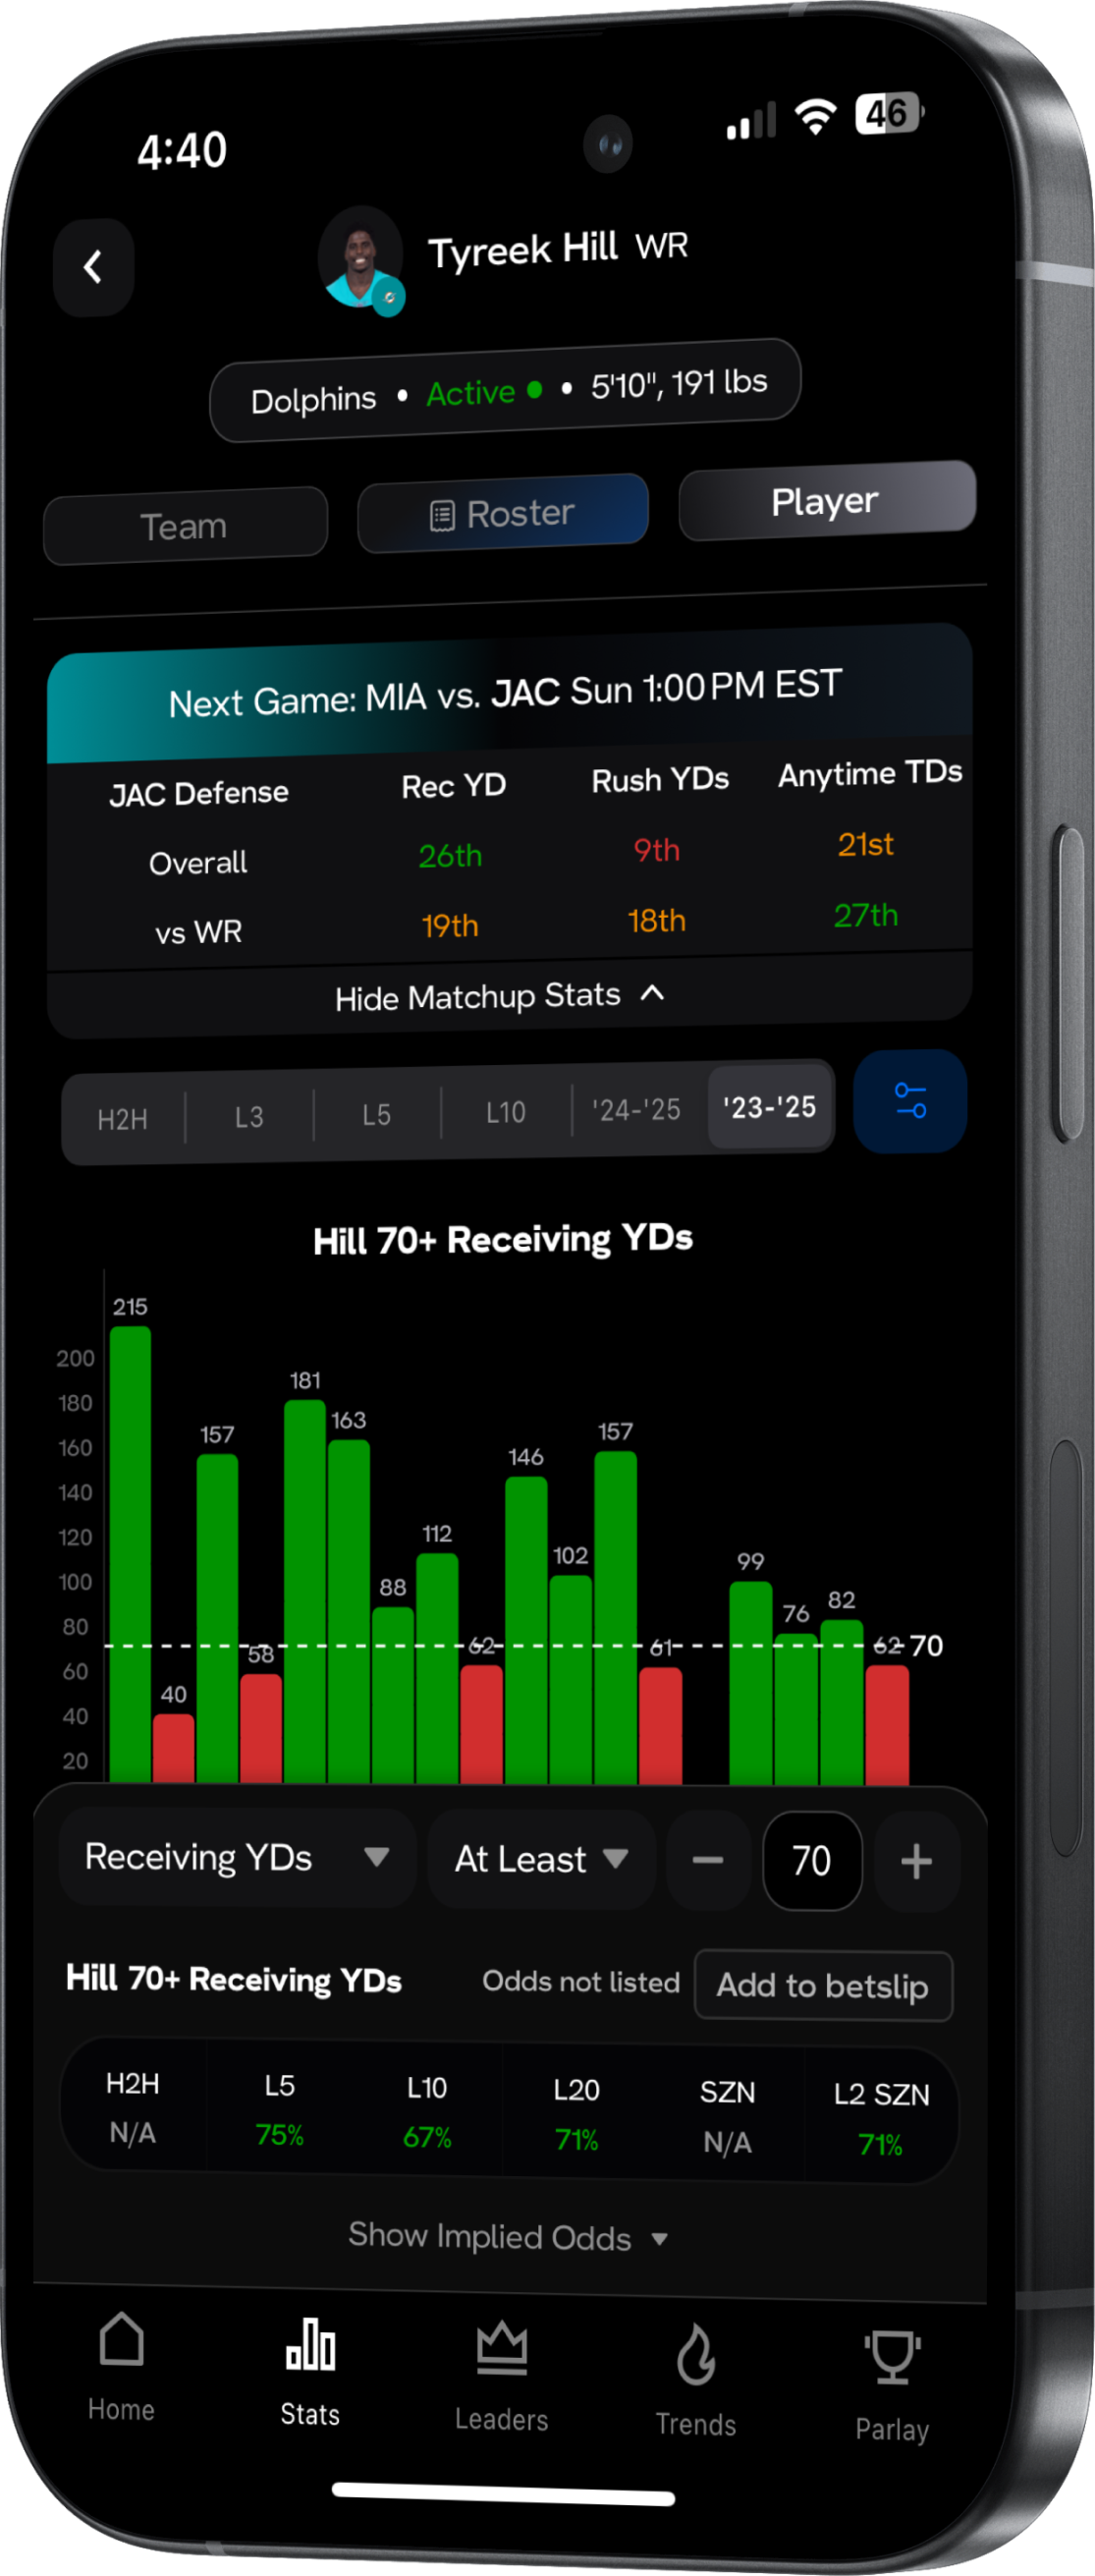
Once you’ve scoped out the high-level view on the home page, it’s time to drill down into individual player stats. Our Detailed Matchup Charts—found on the stats page for any hitter— is designed to give you a great look into how any specific hitter matchups up against their opponent.
This first box will give you a breakdown for both the upcoming pitcher and opposing bullpen, giving you a full look into how their hitting may change throughout the game. In this box, you will find the following stats:
- ERA (Earned Run Average)
- WHIP (Walks + Hits per Inning Pitched)
- Strikeouts (K)
- Hits
- Home Runs
These stats can give you a look into the quality of the upcoming pitcher and identify if there is any particular weakness that this batter can exploit. Our example for this chart comes from an upcoming matchup between divisional foes in the Chicago White Sox and the Minnesota Twins.

Looking into the data for White Sox left fielder Benintendi, you can see that he is looking at relatively tough matchups across the board. To get a better understanding of how he has matched up against the Twins, let’s move to the next section.
4. Batter vs. Pitcher Matchup Analysis (Stats Page)
Last but certainly not least, our newly enhanced Batter vs. Pitcher Matchup Analysis is a powerful tool for anyone who loves a player prop bet. Using this tool, you can see data from the last three seasons, giving you a wide scope of how the specific plate appearances have resulted for this player. In this section that is focused on the batter, you will find:
- Plate Appearances (PA)
- Hit %
- Slugging % (SLG)
- Home Run %
- Walk % (BB %)
This data is shown across a few different conditions, including the upcoming starter, the bullpen, pitchers that have the same throwing hand as today’s starter, and finally all games. Let’s look at this data from Benintendi and see if there is a good area for us to find a prop in.

Looking at this chart, we can see that he has struggled quite a bit against the upcoming starter for the Twins on a decent sample size, but he has performed pretty well against the bullpen. Among those stats, it looks like a hit for Benintendi would be the safest bet to hone in on. Let’s add that to our betslip.
Putting It All Together: Building a One-Game Bet Slip
Now that we’ve covered each tool, let’s piece them together for a single wager. Think of this final section as your step-by-step tutorial:
- Start with Pitcher Ratings to decide if you want to bet on a side or the total.
- Check Recent Batting Form to confirm whether either offense has been performing well enough to swing your pick.
- Dig Deeper with Opposing Pitcher Ratings to ensure there are no hidden bullpen issues or major disparities that could change the in-game dynamics.
- Zero in on Batter vs. Pitcher Matchups if you want to add a player prop bet or two for extra value.
By the end of this sequence, you’ll have crafted a unified, data-driven approach to the game. Throughout this article, I have put together some plays for today’s betting slate, so let’s see how everything looks in the Parlay Optimizer.

Though the sample size is relatively small with only five games played so far this season, the value looks immense. With a hit rate of 64% this parlay has implied odds of -178. Comparing this to the odds offered on DraftKings of +299, that gives this play an incredible edge of 39%!
Conclusion
Whether you’re an experienced bettor or brand-new to the MLB wagering scene, having clear visuals and data-driven insights can make all the difference. Our updated features—Pitcher Ratings Chart, Recent Batting Form Chart, Opposing Pitcher Ratings, and Batter vs. Pitcher Matchup Analysis—put all of this critical information at your fingertips. By walking through each tool step by step, we hope to make your betting experience not only smoother but more profitable.